Wednesday, July 25, 2018

Digital tools for benchmarking and market research


If you are going to lunch a product or a service, the following tools may help you better understand the technical and financial requirements of your target customers. These tools are the best used for home products and appliances.

[1] Competitors website:
Visit competitors websites, see what products or services they offer, what are the variants of these products, see pictures and videos, download user manuals, ... etc. 

[2] Google trends:

Google trends is a very powerful tool for understanding the target customers. Using Google trends you can get trends by time, region, and much more. The following can be done but not limited to:
- Know which cities/states/countries are more interested in certain products or services.
- Which intervals of the year a certain product is in high demand.
- How product or service demand growed during the last years.
- What are the keywords the customers search for more.
- Which language the customer prefer to search for a certain product or service. 
- Compare trends of multiple search items.

As a worked example, the chart and map below show a comparison between search trends for both Jumia and Souq during 2018 in Egypt. Definitely, we can get out the following information:
- Both Jumia and Souq had high traffic in November because of Black Friday campaigns
- Souq has always higher interest than Jumia the whole year
- It seems that Jumia had started the Black Friday campaign a couple of days earlier than Souq.


[3] Google play store:

For products that are linked to smart phone applications, you can get figures about number of downloads and user reviews from the play store.


[4] YouTube channels:
You can get better figures about your expected customers by reviewing number of subscriptions of relevant channels.


[5] YouTube commercials:
Check commercials of competitors on YouTube, see what are the features or services they offer, what are the features they emphasize on, .... etc

[6] YouTube reviews videos:
On YouTube, there are a  lot of reviewers who review products technically, tell the advantages and disadvantages of the product in more sensible way.

YouTube comments:
Navigate through video comments, check the feedback of people, classify them to promoters and ditractors.


[7] Search on Amazon: 
Search on Amazon for related products, check what are the available products, see their pictures, get average prices, and study and collect specifications.

[8] Amazon reviews:
Amazon reviews are trusted and pretty useful, but make sure not to give any false impressions based on few comments.

[9] Search on Facebook:
Search on Facebook with different keywords about the product, see pictures uploaded by users, and see what people say about it. Facebook is not searchable by Google, so try not to ignore Facebook search.

[10] Facebook page likes:
Check number of likes and followers of competitors Facebook pages.

[11] Facebook advertising:
You can use Facebook advertising filters to know the audience size of certain product or service very accurately based:
- Gender
- Geographic location
- Age
- Status keywords
- Liked pages
- Activity duration

[12] Facebook comments and emoticons:
Analyze customers response, read comments of people, get their impressions, check out their hash tags.

[13] OLX:
By using OLX you can understand the following:
- How much customers are looking for your product or service
- How much a certain product or service is sold
- Reselling of used products and the reasons behind reselling
- The relationship between customer class and product category
- The customer behavior of using products by analyzing picture data and advertisement details
- Product life span
- Product deterioration by analyzing the visual status of the product.


[14] Air bnb:
The same as OLX, using Air bnb can give better understanding for how a portion of your customers are using your products by analyzing pictures data.


Tuesday, July 24, 2018

DOE: Resolution III Plackett-Burman design

In Design of Experiments DOE, Plackett-Burman design is one of the screening designs which is used to detect the most significant factors out of large number of factors. The idea behind this design is to make number of level combinations of any two factors is the same through the whole design. To achieve this criteria, massive iterations are required; for this reason statisticians decided to calculate this design offline and save it instead of calculating it each time. 

Plackett-Burman design is based on 2-level factors and has a resolution of III. 


To construct Plackett-Burman design we first calculate number of runs. Number of runs is a multiplier of 4: e.g. 4,8,12,16,.... where number of runs should be larger than number of factors. For example, 9 factors will require 12-runs Plackett-Burman design. Simply, number of runs of this design can be calculated by the simple following equation:


Number of runs=ceiling((Number of factors+1)/4)*4


Since the treatments of this design are pre-calculated, there are two ways to get these treatments. In this article we will go through an example of 12-runs Plackett-Burman design.


The first method is to use what is called the "generating vector". The generating vector is a pre-calculated vector of all levels of the first factor (factor A) except for the last level. For example, the generating vector of 12-runs design will has the length of 11. In this method, treatments will be created by writing all levels of each factor column one by one.


To create treatments, we start with the first factor and assign the following vector to its levels:

++-+++---+-


Where "+" denotes the high level and "-" denotes the low level. Reading this vector from left to right represent factor levels from top to bottom in the design matrix.

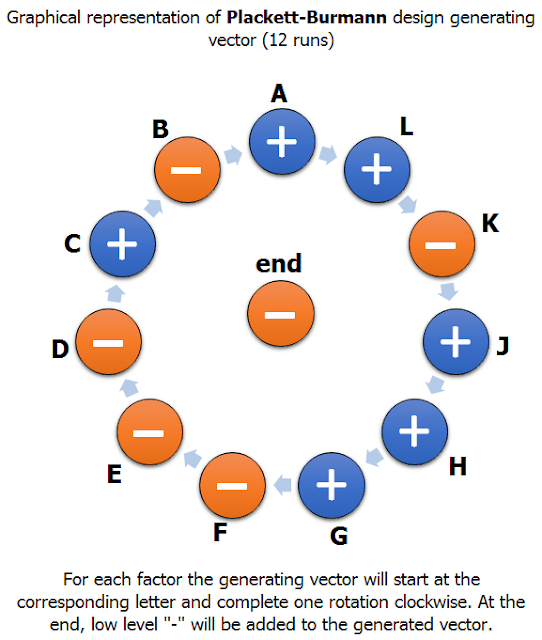
After that, each vector of each factor will be derived from the previous vector. For example, vector B will be derived from vector A, vector C will be derived from vector B and so on. Simply, the last element of vector A will be the first element of vector B. This is better imagined by assuming that the generating vector forms a closed circle and each factor vector will start with the last value of the previous vector. The following image can explain how this may look like.


At the end, after generating all vectors, the last level of each factor will be set to low level "-". Or in other words, the last treatment in the table will be with all factors set at low level.

The following .GIF animation shows how the generation of each vector is derived from the previous vector.


Alternatively, the second method, some books prefer to give the entire table of factor levels for all treatments. Programming wise, the single generating vector has the advantage of small memory consumption and the disadvantage of extra processing time. The following table shows all treatments for 11 factors. It is very noticeable how diagonal the matrix looks like because of shifting explained before.


References:


https://www.itl.nist.gov/div898/handbook/pri/section3/pri335.htm

https://en.wikipedia.org/wiki/Plackett%E2%80%93Burman_design


Key words:

Plackett-Burman design

Minitab Plackett-Burman design

Plackett-Burman design matrix

Plackett-Burman design pattern

Plackett-Burman design table

Plackett-Burman design algorithm


Plackett-Burman design step by step

Sunday, July 22, 2018

How automatic water feeder works

Few days ago, I was thinking how the automatic water feeder (dispenser) of pets and birds works. I searched over the internet and the answers seemed to be very traditional "air has to replace the water going out"!!!!.

The automatic water feeder is a simple mechanical device that is intended to continuously and automatically feed water for pets and birds without the need to refill it frequently. The innovation in this device that water feeding is done without flooding or over flow.

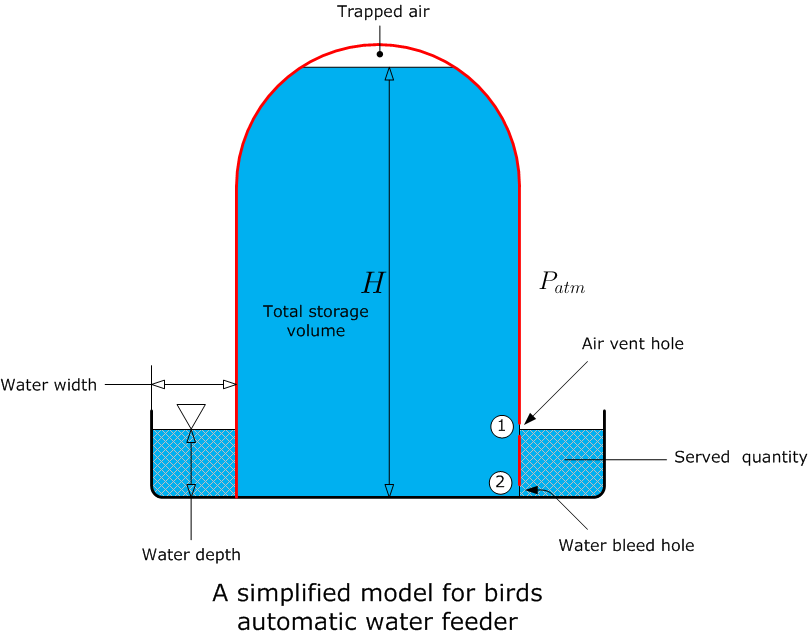
Simply, the automatic water feeder consists mainly of two elements: tank and sump. Referring to the schematic below, the tank has two properly sized holes at two different heights (extremely small holes will not allow air flow or water flow because of surface tension force).  The bottom hole is the water feeding (bleeding) hole and the top one is the air hole. The ratio between the volume of the tank and the volume of the sump decides how frequent the user has to refill the tank. The top hole level also decides the maximum water level in the sump. The lower hole level decides the wasted water volume inside the tank that can not be fed to the sump.


The same concept also exist in the domestic cold and hot water dispenser.

The tank used in most common automatic water feeder for birds is a lid which is filled with water, the sump is placed over it, and then the whole setup is flipped vertically to start working.

So, how this automatic water feeder works?

To answer this question I will explain this on the general physical model of this automatic water feeder as shown in the image above.

After filling the tank and flipping it over, air pressure inside the tank is atmospheric pressure. Water pressure at top and bottom holes is higher than the atmospheric pressure outside, so water flows from both holes but with higher rate from the lower hole (assuming that both holes have the same diameter). As a result, air vacuum increases inside the tank.

Modelling water as a rigid body, there will be a force acting on it because of pressure difference between its sides: a vacuum pressure from one side and atmospheric pressure from the other side. Outside air will push water surface (at hole 1)  inside till the applied force can overcome the surface tension of water, penetrate water, trapped in, and then move up because of buoyancy force until it joins the trapped air at the top of the tank resulting in decreasing the vacuum effect.

This surface tension describes why air is getting inside in an intermittent way in a form of large bubbles. As a result, water will flow out and so on. This will repeat over and over until water level is above the top hole center where a tiny area of the hole is not covered with water. At this instant, air pressure can not exert the enough force on this very tiny area to overcome surface tension and penetrate water and air and water flow will stop.

When outside water level is just covering the top hole, and although the top layer of the outside water still has atmospheric pressure, air can not get inside the tank because air pressure is applied on the whole water surface and water is an incompressible fluid. 

By consuming outside water by pets or birds or due to evaporation, and as long as the water level inside the tank is going down, the flow rate of water from the bottom hole is getting slower because the pressure difference across its sides is reduced.

In this post I tried to proof why water stops at the level of the top hole using mathematical method by studying different general water levels in the sump and assuming a static steady state where the water level is static and this -as a result- means that there is no water flow through both holes. By concept, water will not flow through hole when the pressures on its sides are the same (ignoring pressure drop across the hole). In this model, vapor pressure of water will be ignored.

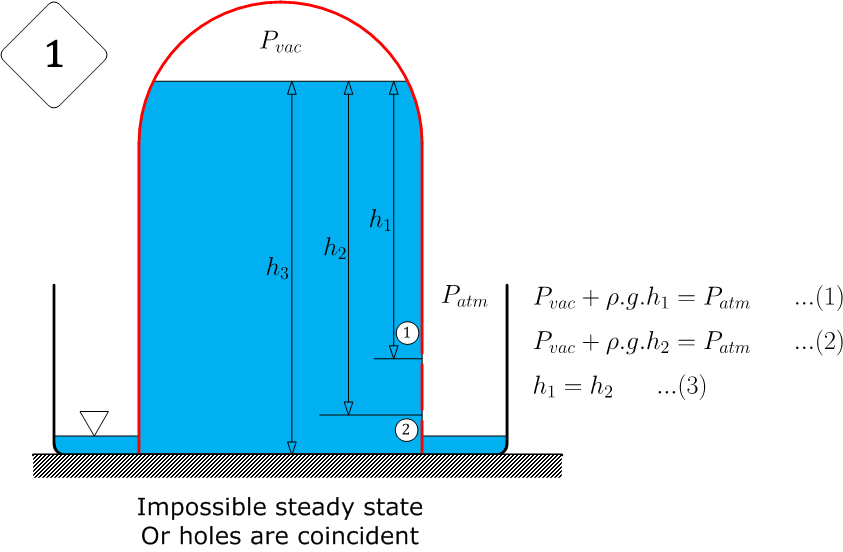
First case: Outside water level below the bottom hole:
By applying the following equations and solving them simultaneously it has two physical solutions:


[A] Top and bottom holes are coincident (one hole). This is not our case because we have two holes.
[B] Impossible to happen if there are two holes at different levels.


Second case: Outside water level above the bottom hole:

By applying the following equations and solving them simultaneously it has two physical solutions:

[C] Water is at the level of the top hole.
[D] Impossible to happen


based on solutions [B] and [C], water will flow as long as it is below the top hole and it will stop flowing only when the water level reaches the top hole.

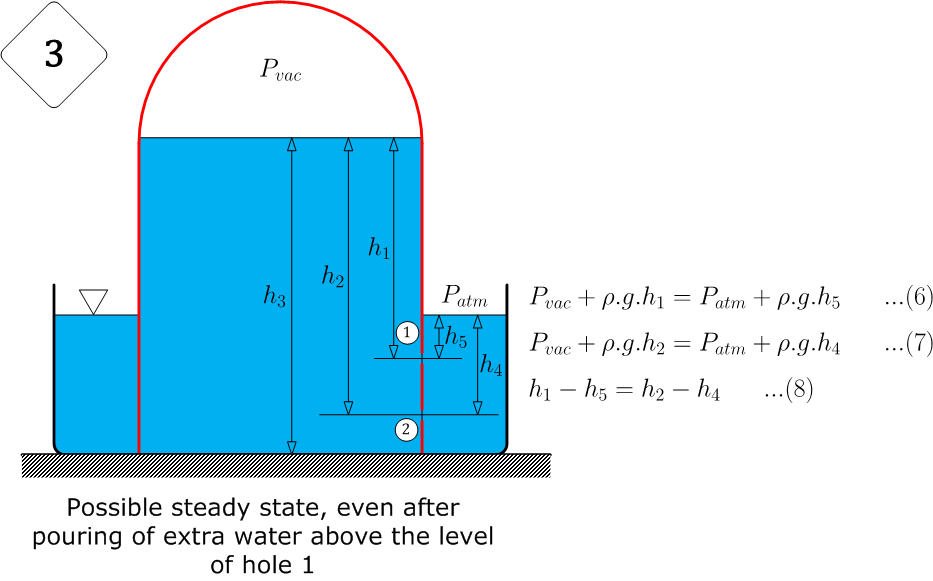
Third case: Outside water level above the top hole:

This case will only happen when extra water is added by the user above the top hole level. By applying the following equations and solving them it has only one physical solution:

[E] It is possible for all water levels above the top hole level as long as the water level is lower than the tip of the sump.


Fourth case: Inside water level below the top hole:

In this case water levels inside and outside will be same.


This theory of operation is only valid for relatively short tanks which are used in domestic and household applications and is impossible to apply for any tank with water level higher than approximately 10 meters (assuming zero absolute pressure above water inside the tank).


References and useful links:


Tags and keywords:

How bird automatic water feeder works

How bird automatic water works

How bird water dispenser works

How pet automatic water feeder works


How pet automatic water works

How pet water dispenser works

Automatic water feeder theory of operation

Automatic water feeder working principle

Tank two holes fluid dynamics

How self filling water bowl works

Monday, July 16, 2018

Mixed level factorial design algorithm

Assume you have a set of factors let's say [A,B,C] and each factor may be assigned different values (let's call these values "levels"). For the purpose of testing (using general full factorial design) you want to try all combinations of all factor levels with each other knowing that each factor may have number of levels different from the other factor. The following table will be used as an example:


Theoretically, to solve this problem, nested "For" loops will be needed where number of loops equals number of factors. This may be impractical to implement specially when number of factors is not constant.

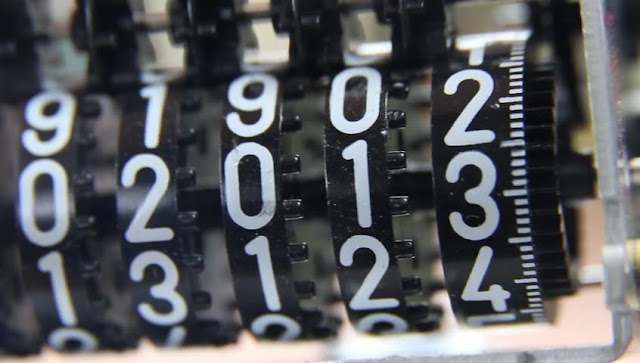
The proposed algorithm simply mimics the mechanical analog counter (or more specifically Tally counter) like the one shown in the picture below but with a slight difference in implementation. In analog counter, the rightmost digit wheel is the driving wheel and when it increases above 9 it will reset back to 0 and the next digit one the left will increment by one. The same rule applies for all other digits: when the digit value increases above 9 it resets to 0 and increment the next digit on the left side by one.  

Reference: https://www.shutterstock.com/video/clip-4902245-analog-mechanical-counter-numbers-that-turned-quickly

In mechanical analog counter, all digits have an upper value of 9 and lower value of 0. On the other side, in this algorithm, each digit will have its own upper value which equals the number of levels while the lower value will be 1.

Let's assume that factor A will be represented by the digit wheel on the leftmost side and factor C will be on the rightmost side so that factor C will be the driving wheel.

By knowing the number of levels of each factor we can calculate the total number of combinations N by multiplying all factor levels (N=3*2*4=24 in this example).

Now, we will increment factor C for N times and after each increment we will do a check for all factors (digits), if any factor exceed its upper bound, it will reset to 1 and increment the next digit on the left side by one.

The counting process of the previous example will look like the simple animation shown below:


This algorithm is very efficient and -theoretically- has no limitation on number of factors or number of levels.

The following VBA code can be used to implement the previous algorithm

Sub CreateTreatments()

Const NoOfFactors = 3

Dim MaxLevels(NoOfFactors) As Integer
Dim FactorLevels(NoOfFactors) As Integer
Dim Letters(NoOfFactors) As String


' Define factor letters
Letters(0) = " A"
Letters(1) = " B"
Letters(2) = " C"

' Define number of levels of each factor
MaxLevels(0) = 3
MaxLevels(1) = 2
MaxLevels(2) = 4

' Reset all factors to the minimum level
FactorLevels(0) = 1
FactorLevels(1) = 1
FactorLevels(2) = 1

' Calculate number of runs (combinations)
NoOfRuns = 1
For i = 0 To NoOfFactors - 1
NoOfRuns = NoOfRuns * MaxLevels(i)
Next i

For i = 1 To NoOfRuns

' Create combination text
CombinationString = ""
For j = NoOfFactors To 1 Step -1
CombinationString = Letters(j - 1) + CStr(FactorLevels(j - 1)) + CombinationString
Next j

FactorLevels(NoOfFactors - 1) = FactorLevels(NoOfFactors - 1) + 1    'Increment rightmost digit

For j = NoOfFactors To 2 Step -1    'For all digits
'If factor level is higher than number of levels, then reset it and increment the left digit
If FactorLevels(j - 1) > MaxLevels(j - 1) Then
FactorLevels(j - 1) = 1
FactorLevels(j - 2) = FactorLevels(j - 2) + 1
End If
Next j

Debug.Print CombinationString

Next i

End Sub


This code will output the following lines in debug window:

A1 B1 C1
A1 B1 C2
A1 B1 C3
A1 B1 C4
A1 B2 C1
A1 B2 C2
A1 B2 C3
A1 B2 C4
A2 B1 C1
A2 B1 C2
A2 B1 C3
A2 B1 C4
A2 B2 C1
A2 B2 C2
A2 B2 C3
A2 B2 C4
A3 B1 C1
A3 B1 C2
A3 B1 C3
A3 B1 C4
A3 B2 C1
A3 B2 C2
A3 B2 C3
A3 B2 C4


Keywords:

Mixed level factorial design algorithm