In this post I show a bug in blogger image encoder. When uploading images with white color background, the white color is displayed as light grey for some image extensions. I tested these images on Google chrome and internet explorer and does not seem a problem of the browser.The following are some tests for different image extensions.
التسميات
- Computational Science (21)
- Mechanical Engineering (85)
- Misc. (48)
- PowerPoint (1)
- Scilab (15)
- VBA Programming (25)
الاثنين، 24 فبراير 2014
Selection of measuring devices
The following points are helpful when selecting most of measuring devices:
Storage conditions:
Storage temperature and humidity
Working conditions:
Ambient temperature range
Humidity range
Sensitivity:
The minimum unit | step of measurement
Maximum measurement value
Auto-range or manual range:
Auto-range is preferred for non-professionals and for time saving
Resolution:
The number of right digits that can be displayed
Display | Screen type:
- Mon-color
- 7 segment or 15 segment display
- Dot matrix display
- Color display
Display | screen size:
The dimensions of screen
Display graph
Measuring units:
Different measuring units save the time of unit conversion
Response time | Stabilization time:
Time needed to reach the true value.
Hardware overload protection
Accuracy:
Tolerance of measurement +/- as an absolute value of a percentage of full scale reading. How much far the measured value from the actual value.
Precision | Repeat-ability:
How often the reading is repeated or how near the measured values.
Linearity:
How the electric signal is varying with the measure physical property. The higher the linearity, the lower number of points needed for calibration.
Sampling time:
The frequency of updating measurements
Recording/logging
Internal memory size:
Internal memory size for storing measured values
Power source:
- Direct AC current (internal adapter).
- Voltage range and frequency
- AC current with adapter
- Internal battery:
- Battery life
- Maximum battery on time
- Internally-recharged
- Externally recharged
On-screen battery indicator
Ruggedness:
The maximum drop distance after which the device malfunctions or is destroyed
Auto-power off time
Portability
Calibration:
-Has traced calibration certificate from NIST
-Can be calibrated: offsets can be saved in the device
Computer interface connection:
- RS 232
- USB
- HDMI
- Wireless
Computer software
- Device configuration from PC
PC-Online reading | recording
Open channel/not connected probes | sensors detection
Wrong probes | sensors connection detection:
This function is useful in multiple-function measuring devices
Replaceable overload protection
Device sealing | Keypad sealing
Device mounting options:
- Adjustable legs
- Magnetic -mount
- Screw mount
External Vs. internal sensor
Taring | Zeroing
Hold manual Vs. Automatic
Minimum, maximum, average
Counting:
This feature is available in tachometers, and balances
Programmable limit alarm
Buzzer sound quality
Probe length
Probe dimensions
Storage conditions:
Storage temperature and humidity
Working conditions:
Ambient temperature range
Humidity range
Sensitivity:
The minimum unit | step of measurement
Maximum measurement value
Auto-range or manual range:
Auto-range is preferred for non-professionals and for time saving
Resolution:
The number of right digits that can be displayed
Display | Screen type:
- Mon-color
- 7 segment or 15 segment display
- Dot matrix display
- Color display
Display | screen size:
The dimensions of screen
Display graph
Measuring units:
Different measuring units save the time of unit conversion
Response time | Stabilization time:
Time needed to reach the true value.
Hardware overload protection
Accuracy:
Tolerance of measurement +/- as an absolute value of a percentage of full scale reading. How much far the measured value from the actual value.
Precision | Repeat-ability:
How often the reading is repeated or how near the measured values.
Linearity:
How the electric signal is varying with the measure physical property. The higher the linearity, the lower number of points needed for calibration.
Sampling time:
The frequency of updating measurements
Recording/logging
Internal memory size:
Internal memory size for storing measured values
Power source:
- Direct AC current (internal adapter).
- Voltage range and frequency
- AC current with adapter
- Internal battery:
- Battery life
- Maximum battery on time
- Internally-recharged
- Externally recharged
On-screen battery indicator
Ruggedness:
The maximum drop distance after which the device malfunctions or is destroyed
Auto-power off time
Portability
Calibration:
-Has traced calibration certificate from NIST
-Can be calibrated: offsets can be saved in the device
Computer interface connection:
- RS 232
- USB
- HDMI
- Wireless
Computer software
- Device configuration from PC
PC-Online reading | recording
Open channel/not connected probes | sensors detection
Wrong probes | sensors connection detection:
This function is useful in multiple-function measuring devices
Replaceable overload protection
Device sealing | Keypad sealing
Device mounting options:
- Adjustable legs
- Magnetic -mount
- Screw mount
External Vs. internal sensor
Taring | Zeroing
Hold manual Vs. Automatic
Minimum, maximum, average
Counting:
This feature is available in tachometers, and balances
Programmable limit alarm
Buzzer sound quality
Probe length
Probe dimensions
الأحد، 23 فبراير 2014
Cold appliances/Refrigerators/Freezer test analysis Excel add-in
For domestic (house-hold) refrigerators, refrigerators-freezers, and freezers being tested according to the standards IEC 62552, ISO 15502, or ANSI/AHAM HRF-1-2004; I have developed an Excel add-in that help in analyzing test data recorded by data acquisition system (temperatures, pressures, electric current, voltage, power, power factor, energy consumption).
What is really good in this add-in that it can be helpful for any laboratory/test engineer regardless the software used in acquisition. The add-in is programmed based on the field experience. It also can work with any number of temperature or pressure measurements. No matter how large the measurements record is large.
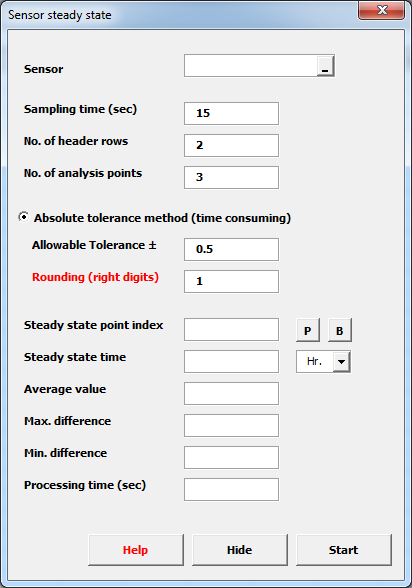
The add-in has two versions: one for Microsoft Excel 2007 and the other for Microsoft Excel 2010 as it is has the standard office ribbon control. It is programmed in native VBA code and user forms. It is interactive and may be used with any number of files opened in Excel. The add-in is still under development (error-proofing, error messages, and documentation), but here you are some snapshots of the basic general tool-boxes in it.
The standard ribbon interface:
Sensor compliance check:
Gap/overlap analysis:
Virtual channel analysis:
Compressor cycle analyzer:
Defrosting thermostat analysis:
Defrosting heating system analysis:
Pull-down times:
Pull-down steady state detection:
Compressor startability test analysis:
Test summary:
What is really good in this add-in that it can be helpful for any laboratory/test engineer regardless the software used in acquisition. The add-in is programmed based on the field experience. It also can work with any number of temperature or pressure measurements. No matter how large the measurements record is large.
The add-in has two versions: one for Microsoft Excel 2007 and the other for Microsoft Excel 2010 as it is has the standard office ribbon control. It is programmed in native VBA code and user forms. It is interactive and may be used with any number of files opened in Excel. The add-in is still under development (error-proofing, error messages, and documentation), but here you are some snapshots of the basic general tool-boxes in it.
The standard ribbon interface:
Sensor compliance check:
Gap/overlap analysis:
Virtual channel analysis:
Compressor cycle analyzer:
Defrosting thermostat analysis:
Defrosting heating system analysis:
Pull-down times:
Pull-down steady state detection:
Compressor startability test analysis:
Test summary:
الخميس، 6 فبراير 2014
Detecting local minimum and maximum points
In this post, I introduce a new method to detect local minimum and local maximum points for a curve drawn by a discrete set of points. That means we don't have a mathematical formula for the curve and as a result we can't calculate local minimum and maximum points by differentiation to detect points of zero slope. I needed this method to detect local minimum and maximum points for a series of points (more than 30000 points) that are recorded by data acquisition system (temperatures).
If noise is exist in values and the points don't seem to form a single continuous mathematical function (more than function, so the local maximum and minimum points may be sharp vertices), then this method is highly recommended, but with some improvements needed.
The method simply is to divide the domain into relatively large number of divisions and detect the global maximum and global minimum of each division. The method looks like the bisection method for solving equations by iteration.
From one side, the global maximum in the division should be compared with the values at the start and the end of the interval. If the global maximum is not on the interval boundaries (larger than boundary points) , then it is a local maximum. The same concept applies for the detection of the local minimum. If the local minimum is not on the interval boundaries (lower than boundary points), then it is a local minimum.
The following illustrative figure (which is not my case) is for a friction-damped vibrating mass-spring system (Coulomb dry friction model) showing the displacement of mass versus time.
The white points show the boundary points of intervals, the green points show the local maximum points, and the blue points show the local minimum points.
For sure, some divisions will not contain local minimum or maximum points, while some will contain. Theoretically, number of divisions should be higher than the number of local minimum and maximum points.
One of the draw backs of this method is when the local maximum or minimum point is coincident with one of the interval boundaries (see the red point). This drawback can be solved by iterating with different number of subdivisions and check if there is any change or not (looks like the boundary conditions analysis in CFD). Also, it can be solved by shifting the boundaries of divisions with small amount and re-apply the method again.
Another draw back is when there are more than one point having the same maximum value.
Update:
In case of a curve that is cycling around an average value; a smart way to detect number of divisions is to calculate the average of the curve, then the interval boundaries are composed of the following points:
- Start point of the curve
- Intersection points of average line (reference line) with the curve
- End point of the curve
The following figure shows the implementation of automatic detection of number of divisions. The reference line may not be the average value, but may also be a user-input value.
If noise is exist in values and the points don't seem to form a single continuous mathematical function (more than function, so the local maximum and minimum points may be sharp vertices), then this method is highly recommended, but with some improvements needed.
The method simply is to divide the domain into relatively large number of divisions and detect the global maximum and global minimum of each division. The method looks like the bisection method for solving equations by iteration.
From one side, the global maximum in the division should be compared with the values at the start and the end of the interval. If the global maximum is not on the interval boundaries (larger than boundary points) , then it is a local maximum. The same concept applies for the detection of the local minimum. If the local minimum is not on the interval boundaries (lower than boundary points), then it is a local minimum.
The following illustrative figure (which is not my case) is for a friction-damped vibrating mass-spring system (Coulomb dry friction model) showing the displacement of mass versus time.
The white points show the boundary points of intervals, the green points show the local maximum points, and the blue points show the local minimum points.
For sure, some divisions will not contain local minimum or maximum points, while some will contain. Theoretically, number of divisions should be higher than the number of local minimum and maximum points.
One of the draw backs of this method is when the local maximum or minimum point is coincident with one of the interval boundaries (see the red point). This drawback can be solved by iterating with different number of subdivisions and check if there is any change or not (looks like the boundary conditions analysis in CFD). Also, it can be solved by shifting the boundaries of divisions with small amount and re-apply the method again.
Another draw back is when there are more than one point having the same maximum value.
Update:
In case of a curve that is cycling around an average value; a smart way to detect number of divisions is to calculate the average of the curve, then the interval boundaries are composed of the following points:
- Start point of the curve
- Intersection points of average line (reference line) with the curve
- End point of the curve
The following figure shows the implementation of automatic detection of number of divisions. The reference line may not be the average value, but may also be a user-input value.
الاثنين، 13 يناير 2014
Thermoelectric cooler Alcohol bath
For the purposes of calibration of temperature sensors at low temperatures or for testing thermo-switches the following layout may be used to make Alcohol cooling bath. The idea beyond using Alcohol is that it has low freezing temperature (-114 C) so it will not freeze in the negative temperature ranges like water which will act like an insulator when it turns into ice. Also, using air as a cooling medium is obviously not reliable because it has low convection heat transfer coefficient, low thermal capacity (and hence low temperature stability), besides the moisture content of air will form frost on the cold sides of the thermoelectric cooler modules resulting in insulation effect.
As you can see in the image above, the insulation cap (on top) not only work as an insulator, but it also prevents the evaporation and loss of Alcohol which has high volatility.
The cooling capacity may be increased by just increasing the number of thermoelectric coolers (something like the image below). Increasing number of thermoelectric cooler modules for the same path will increase its volume resulting in larger steady state time and may lead to radial non-homogeneity of temperature distribution across the bath.
As you can see in the image above, the insulation cap (on top) not only work as an insulator, but it also prevents the evaporation and loss of Alcohol which has high volatility.
The cooling capacity may be increased by just increasing the number of thermoelectric coolers (something like the image below). Increasing number of thermoelectric cooler modules for the same path will increase its volume resulting in larger steady state time and may lead to radial non-homogeneity of temperature distribution across the bath.
الجمعة، 10 يناير 2014
Stair climbing wheel
This post is just a demonstration for the layout and basic dimensions of a stair climbing wheel. Stair climbing wheels are commonly used in market carts and appliance trucks. There are two types of them: manual drive and motor drive. The later is used mainly in robots, space landers, and some toy cars.
Stair climbing wheels are (in most cases) only efficient in stair climbing because they are not supposed to turn right or left while climbing stairs. Using stair climbing wheels in carts or trucks (the truck will have two units of wheel cluster) that move on flat grounds is difficult when you try to turn right or left (specially when the spacing between wheel centers are large) because the system will have 4 fixed-direction parallel wheels (imagine a car with four wheels that all of them are aligned and parallel, it will never turn).
Stair climbers should be designed for a given stair step because they will not work properly for any height.
Stair climbing wheels are (in most cases) only efficient in stair climbing because they are not supposed to turn right or left while climbing stairs. Using stair climbing wheels in carts or trucks (the truck will have two units of wheel cluster) that move on flat grounds is difficult when you try to turn right or left (specially when the spacing between wheel centers are large) because the system will have 4 fixed-direction parallel wheels (imagine a car with four wheels that all of them are aligned and parallel, it will never turn).
Stair climbers should be designed for a given stair step because they will not work properly for any height.
How to make square cavity in ABS plastic sheet
This post is talking about how to make a square cavity cut in thick ABS plastic sheet (or any soft plastic sheet like HIPS). In my case it was 5 mm thick ABS sheet. I needed this when I was trying to make a fixture for a Peltier cooler 40 mm x 40 mm. The tools you will need are almost available at home:
1. Stainless steel ruler
2. Rigid blade cutter
3. Cup saw bit
4. Electric drill
5. Lineman plier (http://en.wikipedia.org/wiki/Lineman%27s_pliers)
Just follow the instructions on the image below.
1. Stainless steel ruler
2. Rigid blade cutter
3. Cup saw bit
4. Electric drill
5. Lineman plier (http://en.wikipedia.org/wiki/Lineman%27s_pliers)
Just follow the instructions on the image below.
الأربعاء، 8 يناير 2014
Fair random number generator
When you listen to a list of tracks (assuming you have 100 sound tracks on your pen-drive or CD) in your car and apply the random mode, you will notice that you listen to a specific track more than once per 100 played tracks... Case 1
One day, I was in a training in soft skills and each one in the training was asked to present himself in front of others. So.. for justice and fair, the instructor suggested to assign numbers for the attendant people (13 guy) and use random number generator in Microsoft Excel to select people, so no one will refuse or show complaint. The funny thing was that I was selected for more than 4 times because of such a function and the same for other colleagues... Case 2
Based on the previous cases, this is just a simple VB Macro code for Excel to generate unique random numbers between 1 and 100.
One day, I was in a training in soft skills and each one in the training was asked to present himself in front of others. So.. for justice and fair, the instructor suggested to assign numbers for the attendant people (13 guy) and use random number generator in Microsoft Excel to select people, so no one will refuse or show complaint. The funny thing was that I was selected for more than 4 times because of such a function and the same for other colleagues... Case 2
Based on the previous cases, this is just a simple VB Macro code for Excel to generate unique random numbers between 1 and 100.
Sub FairRandom()
Dim final, i, j, top
As Integer
last = 1 'Last written
cell
bottom = 1 'Bottom value
of random function
top = 100 'Top value of
random function
For i = 1 To 100000 'For high
number of iterations (infinity)
RN =
Evaluate("RandBetween(bottom,top)")
For j = 1 To final 'check if the
generated random number equals one of the written cells before
If Cells(j, 1) = RN
Then
GoTo 1 'if it is
duplicated, then don't waste time and check the rest of cells
End If
Next j
Cells(j, 2) = RN
last = last + 1 'Increment
last
If last > top
Then
GoTo 2
End If
1
Next i
2
End Sub
|
The code results are shown in the first matrix, while the Excel function RandBetween(1,100) results are shown in the second matrix (Highlighted cells in red are duplicated using conditional formatting).
الثلاثاء، 7 يناير 2014
Google OCR test
One of the main advantages of this method that it will help Google in image search by an image so it can find the images even if they are resized, flipped, or converted to gray scale.
For sure, this method may work also for videos knowing that videos are just successive picture frames.
I tried to make an image having a long word of random letters so it will never appear in search results in Google. I tried to search for the written word and no search results were obtained. May be it takes little time to apply the process or update the tags database. I am not going to write down the word because -for sure- Google will catch the image from it.
How to open files on windows startup (Windows Seven)
In this post I am going to tell you simply how to open some files on windows start-up in Windows Seven. For me, I need this in my work to open some excel files used daily in task management, periodic actions, attendance sheet,... etc. Also, I can open internet or intranet pages as well. This helps as a kind of fool-proofing so you will not miss anything.
All you have to do is go to "Start menu", "All programs", "Startup". Then right click on the "Startup" folder icon and click "Open".
Then the folder will open in a new window (notice the long path). Now, you can place (by copy and paste) any file and/or file shortcut you want to open automatically when Windows starts. It is preferred to use shortcuts, so you will not loose your files when you install new Windows.
All you have to do is go to "Start menu", "All programs", "Startup". Then right click on the "Startup" folder icon and click "Open".
Then the folder will open in a new window (notice the long path). Now, you can place (by copy and paste) any file and/or file shortcut you want to open automatically when Windows starts. It is preferred to use shortcuts, so you will not loose your files when you install new Windows.
الاشتراك في:
الرسائل (Atom)